Laurasian Gleaner
  • Home of the Laurasian Gleaner
  • One New Yorkers Stop & Frisk Blog
  • Blog
  • Arrow Flight Blog

Stop & Frisks by Race - Latinos

11/17/2013

1 Comment

 
Picture
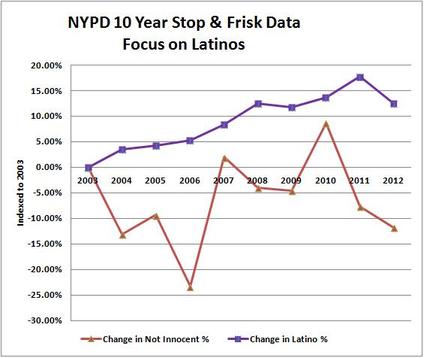
This is a new graph showing the change in "Latino" stop & frisks over time compared to the "Not Innocent" results over time.  ("Not Innocent" means a suspect was arrested or given a summons.  It does NOT mean the suspect was "guilty".)

The NYCLU summary data refers to "Latinos." The NYPD data set for 2011 refers to "Black Hispanics" and "White Hispanics." In 2011 the NYPD stop & frisked 48,438 "Black Hispanics" and 175,302 "White Hispanics which equals the 223,740 stop & frisks the NYCLU summary data lists for "Latinos" for 2011.

The NYCLU only made the full data set available for 2011, so it is impossible for me to make any conclusions between the numbers of "Black Hispanics" versus "White Hispanics" stopped & frisked, over time. In 2011 the NYPD stop & frisked 3.6 times more "White Hispanics" than "Black Hispanics."

According to Census data, people who identify themselves as "Hispanics" identify themselves first as 100% some other race (White, Black, Asian etc.) So "Hispanic" is more of an ethnic, cultural or linguistic affiliation, rather than a racial one. According to Census data, there are slightly more Hispanics (2,400,051) in New York City than Blacks (2,367,952.) although there is some overlap between the two groups.

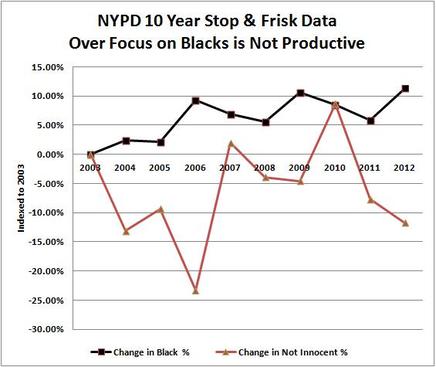
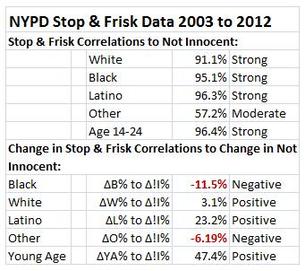
The interesting thing about this chart over time is that the NYPD has been increasing its focus on "Latinos" in a manner similar to its increasing focus on "Blacks." In fact the slope of this line is slightly steeper (0.017102) compared to the slope of the line for Blacks (0.009741.) While neither line, in this chart, looks as if corresponds well to the other, there is in fact a positive +23.23% correlation between the change in Latinos and the change in "Not Innocent" (ΔL% to Δ!I%.) This is the strongest correlation for any race group in the data set. The suggestion is that the Latinos have not yet adapted to being stopped & frisked in the same way that Blacks have. This is possibly because only an average of 146,714 stop & frisks are done of Latinos every year, equal to about 6.1% of the Latino population. Over ten years, the equivalent of only 61.1% of the Latino population has been stopped & frisked. Where as with Blacks about 10.5% are stopped & frisked every year and about 105% of the population has been stopped & frisked over ten years.

In my opinion, it is still an absurd and racist result since the NYPD has stopped & frisked the equivalent of 6 out of every 10 "Latinos" in New York City over the last ten year!  Yes, it is still true that there is a 96.3% correlation between Latino stop & frisks and "Not Innocent" results, which is the highest correlation for any race group.  It is still not correct to assume that 6 out of every 10 "Latinos" are criminals.


1 Comment

Stop & Frisks by Race - Blacks

11/15/2013

1 Comment

 
Picture
In my 09/09/2013 post, Welcome to New York City the Apartheid Police State!, I included Chart 4: “NYPD Stop & Frisk Data: Over Focus on Blacks is Not Productive.”

This is the same chart, with some additional observations.  It motivated me to do a similar chart for each of the other races groups and the young age group.

Notice that the black line, representing the change in percent of Blacks stopped & frisked each year increases steadily over time, from the left to right in this chart, showing and ever increasing focus on selecting Blacks for stop & frisks.  Meanwhile, the red line, representing the change in percent of "Not Innocent" results (suspects arrested or given a summons) does not correspond well with the changes in the increase of Blacks selected for stop & frisks.  In fact the black line steadily increases from 0% to +11.33% while the red line steadily decreases from 0% to -11.75%.  The correlation between the two lines (ΔB% to Δ!I%) is -11.5% which means they are not well related to each other. 

Notice in particularly, that in peak years the NYPD increased their focus on blacks (2006, 2009 and 2012) were also low years for "Not Innocent" results.  Conversely, when the NYPD slackened their focus on blacks in 2007 and 2010 the "Not Innocent" results increased dramatically!

On the other hand, there is an overall positive correlation (+95.1%) between the numbers of blacks stopped & frisked and the numbers of "Not Innocent" results (arrests & summons.)

My interpretation of this is that blacks are adapting over time to stop & frisks, just as people in hostile occupied cities adapt to hostile military occupation.  A black friend, on FaceBook, asked, "How can I adapt?  I am always black  I can't change that!"  That is obviously true.  In the short run, you probably can't change your neighborhood either.  But you do have some choices you may be able to make:
  • You can choose to dress in a hip-hop or 'gangsta' style, and attract police attention, or you can dress like a more normal, boring, citizen. (More on dress below.)
  • You know the police are looking for marijuana, illicit drugs and contraband, so you can choose not to carry these with you on the street.
  • You can avoid carrying tools that might be perceived as “burglary tools.”
  • You know the police are looking for weapons, so you can avoid carrying a gun, knife or other weapon. (This is Mayor Bloomberg's stated goal – to reduce guns on the street.)
  • You may believe that the police are more active at night, so, if you can, you arrange to go to work, or school and do important errands during the daylight.
  • It's been reported that many people are afraid to go out at all, so they are arranging to stay in most of the time.
  • Black & Hispanic trans-women have learned that if they carry more than five condoms in their purse, they will be arrested and accused of prostitution. So they carry fewer than five. (Heaven forbid you are coming home from a pharmacy with a CARTON of condoms! OMG!)
I am not making these as suggestions.  I am suggesting that this is what rational people do when the equivalent of 105% of them have been stopped & frisked over the last ten tears.  No, this is not the way our City should be.  Black people should not have to fear police harassment to live here.

More comments on dress:  All New Yorkers wear black a lot.  This is kind of a New York style "thing."  It may be more of a "thing" with black New Yorkers.  I am a pet sitter and dog walker on Staten Island.  I often drive at night and sometimes through black neighborhoods.  My observations is that there are a lot of black New Yorkers who wear black (and other dark colors) at night.  It makes them hard to see.  (I wear bright & light colors in hopes that cars wont run me over as I walk dogs.)  I wonder if black New Yorkers are wearing more black these days to avoid being seen by the police?  It may be an interesting line of research to compare pedestrian knock downs, by automobiles, in black neighborhoods, at night, to the increasing number of stop & frisks since 2002.  There may be hidden safety costs to stop & frisks.


1 Comment

Stop & Frisk Correlations by Race

11/9/2013

0 Comments

 
Picture
The table at the right shows various correlations between each race/age category to "Not Innocent" results using the Excel CORREL() function to calculate the correlation coefficient. 

Interpretation of the Correlation Coefficient
The correlation coefficient as measures how strong a linear relationship exists between two numeric variables x and y. Specifically:

  •     The correlation coefficient is always a number between -1.0 and +1.0.
  •     If the correlation coefficient is close to +1.0, then there is a strong positive linear relationship between x and y. In other words, if x increases, y also increases.
  •     If the correlation coefficient is close to -1.0, then there is a strong negative linear relationship between x and y. In other words, if x increases, y will decrease.
  •     The closer to zero the correlation coefficient is, the less of a linear relationship between x and y exists
I decided to express the correlation coefficient as a percent:  thus -100% to +100%.

This explanation of the Correlation Coefficient is taken from:
http://pirate.shu.edu/~wachsmut/Teaching/MATH1101/Relations/correlation.html

The NYPD Stop & Frisk Summary Data Provided by the NYCLU:

The data used here is for the years 2003 to 2012.  The NYCLU summary data does not include the details by race for 2002.  Also, the data does not include a value for the "Age 14-25" category for 2012.

The race categories for White, Black & Latino are given in the summary data provided on the NYCLU web page.  The category for "Other" is a calculated remainder: 
Other = Total S&F - White - Black - Latino 

It represents Asians and certain indigenous people living in New York City.

The NYCLU summary data gives a value for "Totally Innocent."  "Not Innocent" is calculated as:
Not Innocent = Total S&F - Totally Innocent
Analysis of the full 2011 NYPD Stop & Frisk data set suggests that "Not Innocent" represents suspects who were arrested, given a summons or both.  It is important to remember the "Not Innocent" does not mean "Guilty."  We do not have data from court records to determine how the arrests and summons were adjudicated.

You can find the NYCLU summary data here:
http://www.nyclu.org/content/stop-and-frisk-data

You can find a copy of my full study explaining this data in more detail here:
http://www.filedropper.com/nypdstopandfiskstudy2003to2012asof2013-09-06

Stop & Frisk Correlations to Not Innocent:

All of the race categories (except Other) show strong correlations to Not Innocent results.  Correlations over +90% are very strong correlations.  The Other category show moderate correlation.  There is also a strong correlation to the Age 14-25 age category.  Thus there is a strong linear relationship between each category and Not Innocent results.  Thus there is no reason to favor one race category over another when choosing suspects to stop & frisk.

Mike Bloomberg & Ray Keller have commented that 95% of crimes are committed by young black males and 95% of those crimes are committed in black neighborhoods.  The COMSTAT program helps identify which neighborhoods.  Even if this is true (I have not examined crime statistics in my analysis) it is not proof that 95% of young black males are criminals!
  The current stop & frisk program is treating all young black males as criminals.  And that is racist.

Change in Stop & Frisk Correlations to Change in Not Innocent:

The Greek letter Delta (Δ) is used in math to signify "change in" such as change in speed.  The exclamation point (!) is used in some programming languages to mean negation, or "Not", thus "!Innocent" means "Not Innocent."

The notation for Blacks, "ΔB% to Δ!I%" should be interpreted to mean, "The change in Black percent over time compared to the change in Not Innocent percent over time."  
Interprting the results:
  • Black: ΔB% to Δ!I%:  The correlation is a mildly negative -11.5%.  The increasing focus on Blacks over time is having negative results and is not producing a proportionate number of Not Innocent results.  It is possible that Blacks are adapting thei behavior to avoid an arrest or summons during a stop & frisk.  (More on this in my next post.)
  • White: ΔW% to Δ!I%:  The correlation is a mildly positive 3.1% suggesting that somewhat more focus on Whites might be warranted.
  • Latino: ΔL% to Δ!I%:  Another correlation that is a mildly positive 23.2%, also suggesting that more focus on Latinos might be warranted.  This is the strongest positive for a race group.
  • Other:  ΔO% to Δ!I%:   Another mildly negative -6.19%.  The NYPD's focus on "Others" has been decreasing,over time, possibly because greater focus isn't warranted.
  • Young Age: ΔYA% to Δ!I%:  The Age Group 14-25 has a moderately positive correlation of 47.4%.  It is the strongest positive correlation among all the categories
Conclusions:  If we we wish to improve the NYPD's success rate (with "Not Innocent" suspects) then:continued strong focus on Blaks is probably not warranted.  However, a continued focus on the Agre Group 14-25 makes sense.  More focus on Latinos is also reasonable.  Perhaps more focus on Whites might make sense.

More on these conclusions in my following posts.


.    .


0 Comments

    Bill Keck

    I am a resident of Staten Island and and began reviewing NYPD Stop & Frisk data published on NYCLU page.

    Archives

    July 2014
    December 2013
    November 2013
    October 2013
    September 2013

    Categories

    All

    RSS Feed

Powered by Create your own unique website with customizable templates.