Laurasian Gleaner
  • Home of the Laurasian Gleaner
  • One New Yorkers Stop & Frisk Blog
  • Blog
  • Arrow Flight Blog

Staten Island, borough where Eric Garner died, has highest number of most-sued NYPD officers

7/28/2014

0 Comments

 
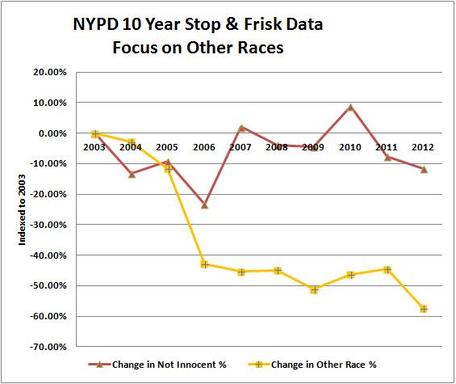
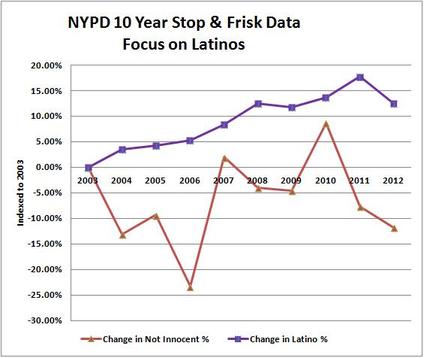
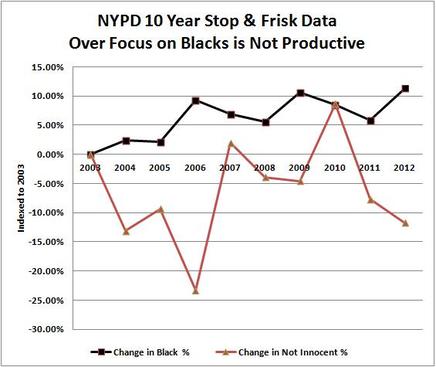
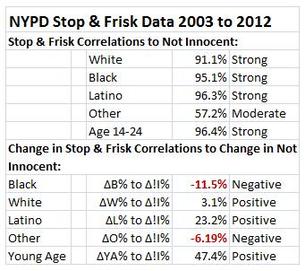
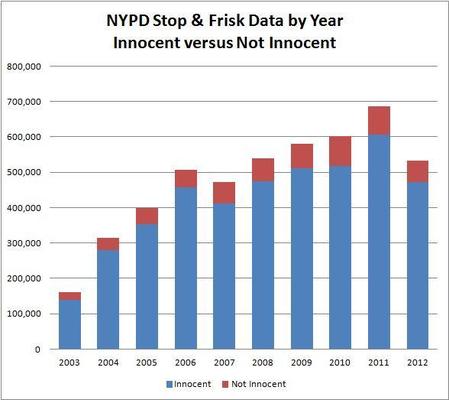
It's often been rumored that the most failed cops in NYC get sent to Staten Island. If they can't get along with Hispanics in the Bronx or Blacks in Brooklyn, they get sent to the hinterlands of Staten Island. So it goes: 14 of the top 50 most sued cops in New York City work on the 40 man drug bust team that patrols Tompkinsville, Staten Island where Eric Garner was killed.

Seven of the city’s top 10 most-sued officers — and 14 of the city’s top 50 most-sued officers — are assigned to a Staten Island narcotics unit working in the territory of the 120th Precinct, a Daily News review has found. The unit has racked up a staggering amount of lawsuits despite being the smallest narcotics bureau in the city.

Daily News, July 28, 2014
http://www.nydailynews.com/new-york/staten-island-highest-number-most-sued-nypd-officers-article-1.1882160

0 Comments

Stop & Frisks by Race - Other Race

12/15/2013

0 Comments

 
Picture
The NYCLU summary data includes Total Stop & Frisks along with values for Blacks, Latinos and Whites stopped and frisked each year.  "Other Race" is a remainder calculated as:

Other = Total - Blacks - Latinos - Whites

The full data set for 2011 includes, the following in the "Other Race" category:

Race Not Recorded:   22,607
Asian/Pacific Islander:   23,932
American Indian/Native Alaskan:   2,897
The total is:   49,436
Which equals exactly the value calculated as "Other Race" above.

Please take note that almost 46% of those in the "Other Race" category are suspect's whose race was not recorded by the NYPD.  Please also note that the categories of
"Asian/Pacific Islander" and "American Indian/Native Alaskan" are the category names used by the NYPD.

Not surprisingly, this mixed group has the lowest correlation to "Not Innocent" results (57.2%) and the change in numbers for this mixed group has a mildly negative correlation (-6.19%) to the change in numbers of "Not Innocent" (ΔO% to Δ!I%).

This chart shows that the NYPD has been ignoring this group over the last 10 years.


0 Comments

Stop & Frisk by Race - White

12/14/2013

1 Comment

 
Picture
This is a new graph showing the change in "White" stop & frisks over time compared to the change in "Not Innocent" percent over time.  ("Not Innocent" means a suspect was arrested or given a summons.  It does NOT mean the suspect was "guilty".)

There are almost 4.5 million White people in New York City, about 54% of the City's population.  Yet Whites are only the subject of about 9.8% of stop & frisks.  Indeed, only about 1.1% of the White population is subject to a stop & frisk in a given year, where as 10.5% of Blacks are. Over the last ten years (2003 to 1012) stop & frisks have been done on the the equivalent of only about 10.5% of Whites, but almost 105% of Blacks.  Mayor Bloomberg has stated, "We disproportionately stop whites too much and minorities too little."

However, the correlations between Whites and "Not Innocent" results is a strong 91.1%.  The change in White% to change in "Not Innocent"% (ΔW% to Δ!I%) is a very modest 3.1%.  The suggestions are that there is a correlation between Whites and "Not Innocent" and thus crime.

And then we come to this graph and, to the eye, we see that the change in 'Not Innocent' percent (Δ!I%) seems to track rather well with the Change in White percent (ΔW%.)  Both percents decrease from 2003 to 2004, while the number of stop & frisks increased to a then high of  313,523.  In part, this increase may have been caused by the civil disturbances surrounding the Republican Convention in New York City in 2004.  In 2005 we see both percents increasing, together, as the number of stop & frisks increased to nearly 400,000.  In 2006 the change in White percent increased modestly, while the total number of stop & frisks increased, for the first time over 500,000 and the change in 'Not Innocent" percent to declined to the lowest level (0nly 9.7% of stop & frisks) in the ten year period.  In 2007 the two lines increase together, while the 'Not Innocent" percent increase to the second highest percent in the period (13.0%.)  They decline together in 2008 then diverge from 2009 to 2012, in spite of the fact that the period high in 'Not Innocent' percent (13.8%) occurs in 2010.  Curiously, all three, the 'Not Innocent' percent, change in 'Not Innocent' percent and change in White percent decline in 2011, even though this period includes the Occupy Wall Street protests, that surely involved disturbances among a number of White youths.

Amy Holmes, of Real News on the Blaze, remarked on Thursday, June 27, 2013, that if the NYPD wanted to police crime and give out summons for illegal use of marijuana, all they need do is hang out by the campus & parks of NYU!  There are lots of nice white, middle class kids there smoking illegal marijuana!  A  police officer could easily reach his “productivity goals.” (As Mr. Bloomberg likes to call them.  “Quotas” are illegal in New York State.)  This is consistent with the "broken window" strategy, outlined in an essay by Wilson and Kelling (1982), "who argued that police responses to disorder were critical to communicate intolerance for crime and to halt its contagious spread."  (1)

Surely, justice could be severed by more focus on Whites.


(1) "An Analysis of the New York City Police department's 'Stop-and-Frisk' Policy in Context of Claims of Racial Bias",
Authors: Andrew Gelman, Jeffrey Fagan and Alex Kiss
Journal of the America Statistical Association,
September, 2007, page 814


1 Comment

Stop & Frisks by Race - Latinos

11/17/2013

1 Comment

 
Picture
This is a new graph showing the change in "Latino" stop & frisks over time compared to the "Not Innocent" results over time.  ("Not Innocent" means a suspect was arrested or given a summons.  It does NOT mean the suspect was "guilty".)

The NYCLU summary data refers to "Latinos." The NYPD data set for 2011 refers to "Black Hispanics" and "White Hispanics." In 2011 the NYPD stop & frisked 48,438 "Black Hispanics" and 175,302 "White Hispanics which equals the 223,740 stop & frisks the NYCLU summary data lists for "Latinos" for 2011.

The NYCLU only made the full data set available for 2011, so it is impossible for me to make any conclusions between the numbers of "Black Hispanics" versus "White Hispanics" stopped & frisked, over time. In 2011 the NYPD stop & frisked 3.6 times more "White Hispanics" than "Black Hispanics."

According to Census data, people who identify themselves as "Hispanics" identify themselves first as 100% some other race (White, Black, Asian etc.) So "Hispanic" is more of an ethnic, cultural or linguistic affiliation, rather than a racial one. According to Census data, there are slightly more Hispanics (2,400,051) in New York City than Blacks (2,367,952.) although there is some overlap between the two groups.

The interesting thing about this chart over time is that the NYPD has been increasing its focus on "Latinos" in a manner similar to its increasing focus on "Blacks." In fact the slope of this line is slightly steeper (0.017102) compared to the slope of the line for Blacks (0.009741.) While neither line, in this chart, looks as if corresponds well to the other, there is in fact a positive +23.23% correlation between the change in Latinos and the change in "Not Innocent" (ΔL% to Δ!I%.) This is the strongest correlation for any race group in the data set. The suggestion is that the Latinos have not yet adapted to being stopped & frisked in the same way that Blacks have. This is possibly because only an average of 146,714 stop & frisks are done of Latinos every year, equal to about 6.1% of the Latino population. Over ten years, the equivalent of only 61.1% of the Latino population has been stopped & frisked. Where as with Blacks about 10.5% are stopped & frisked every year and about 105% of the population has been stopped & frisked over ten years.

In my opinion, it is still an absurd and racist result since the NYPD has stopped & frisked the equivalent of 6 out of every 10 "Latinos" in New York City over the last ten year!  Yes, it is still true that there is a 96.3% correlation between Latino stop & frisks and "Not Innocent" results, which is the highest correlation for any race group.  It is still not correct to assume that 6 out of every 10 "Latinos" are criminals.


1 Comment

Stop & Frisks by Race - Blacks

11/15/2013

0 Comments

 
Picture
In my 09/09/2013 post, Welcome to New York City the Apartheid Police State!, I included Chart 4: “NYPD Stop & Frisk Data: Over Focus on Blacks is Not Productive.”

This is the same chart, with some additional observations.  It motivated me to do a similar chart for each of the other races groups and the young age group.

Notice that the black line, representing the change in percent of Blacks stopped & frisked each year increases steadily over time, from the left to right in this chart, showing and ever increasing focus on selecting Blacks for stop & frisks.  Meanwhile, the red line, representing the change in percent of "Not Innocent" results (suspects arrested or given a summons) does not correspond well with the changes in the increase of Blacks selected for stop & frisks.  In fact the black line steadily increases from 0% to +11.33% while the red line steadily decreases from 0% to -11.75%.  The correlation between the two lines (ΔB% to Δ!I%) is -11.5% which means they are not well related to each other. 

Notice in particularly, that in peak years the NYPD increased their focus on blacks (2006, 2009 and 2012) were also low years for "Not Innocent" results.  Conversely, when the NYPD slackened their focus on blacks in 2007 and 2010 the "Not Innocent" results increased dramatically!

On the other hand, there is an overall positive correlation (+95.1%) between the numbers of blacks stopped & frisked and the numbers of "Not Innocent" results (arrests & summons.)

My interpretation of this is that blacks are adapting over time to stop & frisks, just as people in hostile occupied cities adapt to hostile military occupation.  A black friend, on FaceBook, asked, "How can I adapt?  I am always black  I can't change that!"  That is obviously true.  In the short run, you probably can't change your neighborhood either.  But you do have some choices you may be able to make:
  • You can choose to dress in a hip-hop or 'gangsta' style, and attract police attention, or you can dress like a more normal, boring, citizen. (More on dress below.)
  • You know the police are looking for marijuana, illicit drugs and contraband, so you can choose not to carry these with you on the street.
  • You can avoid carrying tools that might be perceived as “burglary tools.”
  • You know the police are looking for weapons, so you can avoid carrying a gun, knife or other weapon. (This is Mayor Bloomberg's stated goal – to reduce guns on the street.)
  • You may believe that the police are more active at night, so, if you can, you arrange to go to work, or school and do important errands during the daylight.
  • It's been reported that many people are afraid to go out at all, so they are arranging to stay in most of the time.
  • Black & Hispanic trans-women have learned that if they carry more than five condoms in their purse, they will be arrested and accused of prostitution. So they carry fewer than five. (Heaven forbid you are coming home from a pharmacy with a CARTON of condoms! OMG!)
I am not making these as suggestions.  I am suggesting that this is what rational people do when the equivalent of 105% of them have been stopped & frisked over the last ten tears.  No, this is not the way our City should be.  Black people should not have to fear police harassment to live here.

More comments on dress:  All New Yorkers wear black a lot.  This is kind of a New York style "thing."  It may be more of a "thing" with black New Yorkers.  I am a pet sitter and dog walker on Staten Island.  I often drive at night and sometimes through black neighborhoods.  My observations is that there are a lot of black New Yorkers who wear black (and other dark colors) at night.  It makes them hard to see.  (I wear bright & light colors in hopes that cars wont run me over as I walk dogs.)  I wonder if black New Yorkers are wearing more black these days to avoid being seen by the police?  It may be an interesting line of research to compare pedestrian knock downs, by automobiles, in black neighborhoods, at night, to the increasing number of stop & frisks since 2002.  There may be hidden safety costs to stop & frisks.


0 Comments

Stop & Frisk Correlations by Race

11/9/2013

0 Comments

 
Picture
The table at the right shows various correlations between each race/age category to "Not Innocent" results using the Excel CORREL() function to calculate the correlation coefficient. 

Interpretation of the Correlation Coefficient
The correlation coefficient as measures how strong a linear relationship exists between two numeric variables x and y. Specifically:

  •     The correlation coefficient is always a number between -1.0 and +1.0.
  •     If the correlation coefficient is close to +1.0, then there is a strong positive linear relationship between x and y. In other words, if x increases, y also increases.
  •     If the correlation coefficient is close to -1.0, then there is a strong negative linear relationship between x and y. In other words, if x increases, y will decrease.
  •     The closer to zero the correlation coefficient is, the less of a linear relationship between x and y exists
I decided to express the correlation coefficient as a percent:  thus -100% to +100%.

This explanation of the Correlation Coefficient is taken from:
http://pirate.shu.edu/~wachsmut/Teaching/MATH1101/Relations/correlation.html

The NYPD Stop & Frisk Summary Data Provided by the NYCLU:

The data used here is for the years 2003 to 2012.  The NYCLU summary data does not include the details by race for 2002.  Also, the data does not include a value for the "Age 14-25" category for 2012.

The race categories for White, Black & Latino are given in the summary data provided on the NYCLU web page.  The category for "Other" is a calculated remainder: 
Other = Total S&F - White - Black - Latino 

It represents Asians and certain indigenous people living in New York City.

The NYCLU summary data gives a value for "Totally Innocent."  "Not Innocent" is calculated as:
Not Innocent = Total S&F - Totally Innocent
Analysis of the full 2011 NYPD Stop & Frisk data set suggests that "Not Innocent" represents suspects who were arrested, given a summons or both.  It is important to remember the "Not Innocent" does not mean "Guilty."  We do not have data from court records to determine how the arrests and summons were adjudicated.

You can find the NYCLU summary data here:
http://www.nyclu.org/content/stop-and-frisk-data

You can find a copy of my full study explaining this data in more detail here:
http://www.filedropper.com/nypdstopandfiskstudy2003to2012asof2013-09-06

Stop & Frisk Correlations to Not Innocent:

All of the race categories (except Other) show strong correlations to Not Innocent results.  Correlations over +90% are very strong correlations.  The Other category show moderate correlation.  There is also a strong correlation to the Age 14-25 age category.  Thus there is a strong linear relationship between each category and Not Innocent results.  Thus there is no reason to favor one race category over another when choosing suspects to stop & frisk.

Mike Bloomberg & Ray Keller have commented that 95% of crimes are committed by young black males and 95% of those crimes are committed in black neighborhoods.  The COMSTAT program helps identify which neighborhoods.  Even if this is true (I have not examined crime statistics in my analysis) it is not proof that 95% of young black males are criminals!
  The current stop & frisk program is treating all young black males as criminals.  And that is racist.

Change in Stop & Frisk Correlations to Change in Not Innocent:

The Greek letter Delta (Δ) is used in math to signify "change in" such as change in speed.  The exclamation point (!) is used in some programming languages to mean negation, or "Not", thus "!Innocent" means "Not Innocent."

The notation for Blacks, "ΔB% to Δ!I%" should be interpreted to mean, "The change in Black percent over time compared to the change in Not Innocent percent over time."  
Interprting the results:
  • Black: ΔB% to Δ!I%:  The correlation is a mildly negative -11.5%.  The increasing focus on Blacks over time is having negative results and is not producing a proportionate number of Not Innocent results.  It is possible that Blacks are adapting thei behavior to avoid an arrest or summons during a stop & frisk.  (More on this in my next post.)
  • White: ΔW% to Δ!I%:  The correlation is a mildly positive 3.1% suggesting that somewhat more focus on Whites might be warranted.
  • Latino: ΔL% to Δ!I%:  Another correlation that is a mildly positive 23.2%, also suggesting that more focus on Latinos might be warranted.  This is the strongest positive for a race group.
  • Other:  ΔO% to Δ!I%:   Another mildly negative -6.19%.  The NYPD's focus on "Others" has been decreasing,over time, possibly because greater focus isn't warranted.
  • Young Age: ΔYA% to Δ!I%:  The Age Group 14-25 has a moderately positive correlation of 47.4%.  It is the strongest positive correlation among all the categories
Conclusions:  If we we wish to improve the NYPD's success rate (with "Not Innocent" suspects) then:continued strong focus on Blaks is probably not warranted.  However, a continued focus on the Agre Group 14-25 makes sense.  More focus on Latinos is also reasonable.  Perhaps more focus on Whites might make sense.

More on these conclusions in my following posts.


.    .


0 Comments

11 Years of Stop & Frisks with Focus on Innocent and Not Innocent Results

10/8/2013

1 Comment

 
Picture
In my 09/09/2013 post, Welcome to New York City the Apartheid Police State!, I included Chart 4: “NYPD Stop & Frisk Data: Over Focus on Blacks is Not Productive.”  I decided to do a similar chart for each of the other races, but discovered there are underlying anomalies in the data that affect the review.  This chart displays those anomalies.  Notice between 2003 and 2006 there is a drastic drop in the change in Not Innocent Results.  It corrects in 2007, holds level in 2008 & 2009, peaks in 2010 then decreases again in 2011 and 2012.

It is obvious that this change is due to management policies at the NYPD.  My observation is that when the NYPD increases the number of stop & frisks in a year the change in Not Innocent often drops.  In years following, the NYPD corrects their "quality control" to increase the percent of Not Innocent results.

If you recall, "Not Innocent" does not mean that someone is found "Guilty."  It means a suspect in a stop & frisk was arrested, given a summons or both.  This "Not Innocent" result is the proof that the NYPD is effectively fighting crime with stop & frisks!  Overall, the NYPD seems to be satisfied to have slightly less than 12% "Not Innocent" results versus 88% "Innocent" results from stop & frisks.  (The 10 year average is actually 11.9% Not Innocent versus 88.1% innocent.)   This works out to about 1 in every 8.3 to 8.4 stop & frisks has a "Not Innocent" result.  This seems to be the NYPD's target.

Several people have claimed that during the Giuliani Administration crime dropped by a third.  (One of these was Governor David Patterson on a local radio show, "Curtis & the Gov" AM 970, "The Answer.") 

I came across a chart in a report which showed that the Giuliani Administration was doing about 55,000 stop & frisks, while the (early) Bloomberg Administration was doing slightly under 100,000 (around 2002.)  I have not been able to find it again.  

I also heard a show on WNYC (93.9 FM), This American Life, #414: "Right to Remain Silent", Stories about people who have the right to remain silent, but choose not to exercise that right—including police officer Adrian Schoolcraft, who secretly recorded his supervisors telling officers to manipulate crime statistics and make illegal arrests.  On one hand it was positive in that crime has been reduced by about 75% since the 1990s.  On the other hand it claimed the modern statistics may have be compromised by under reporting and misreporting.  (A number of violent rapes, for example were reported as lesser crimes.)  It also documents that the NYPDs approach to stop & frisk has been more quantity with little concern for quality.

You can listen here: 
http://podcast.thisamericanlife.org/podcast/414.mp3

What do I mean by "quality" in a stop & frisk?  "Quality" means the police stops a suspect for probable cause and arrests them, or gives them a summons, or both.  Yes,it is obvious that some stop & frisks will be of people who are innocent, but quality control would reduce this.

I was looking at the summary data provided by the NYCLU and noticed that I had not used the summary data for 2002, because it did not have break downs by race.  However, it really proves my point about quality versus quantity.  In 2002 the NYPD did 97,296 stop & frisks, 80,167 people were deemed innocent, which means that 17,129 were Not Innocent (arrested, given a summons, or both.)  This is the smallest number of stop & frisks in the series, with the highest percent of Not Innocent results, 17.6%.  Only 82.4% were deemed innocent.  This is to say that about 1 in every 5.6 stop & frisks resulted in "success"!  This is the highest "success rate" in the eleven year series!

Here is my new, modified graph to display this:

Picture
Graphed on the Left Hand Scale: Numbers of Stop & Frisks by Year.
In this graph, the "Not Innocent" result is the red columns at the bottom of the chart.  These are the number of "successful" stop & frisks in that they result in an arrest, a summons or both.  Putting these columns at the bottom helps us to see the values.  The lowest value was in 2002 with 17,129 Not Innocent results.  The highest was in 2010 with 82,963 Not Innocent results.  That means that the maximum success was 4.84 times higher than the lowest.

The blue columns, sitting on top of the red columns, are the "Innocent" results.  The low for the Innocents was also 2002 with 80,167 innocent people stopped.  The high for innocent results is in 2011 with 605,328 innocent people stopped & frisked.  From low to high, 7.55 times more innocent people were stopped & frisked in 2011 compared to 2002.  

The two columns together show the total stop & frisks per year.  Once again the low is in 2002 where 97,296total people were stopped and frisked.  And the high is in 2011 where 685,724people in total were stopped & frisked.  From low to high 7.05 times more people were stopped & frisked in 2011 than in 2002. 

In summary, from low to high:  7.05 times more people were stopped & frisked and 7.55 times more innocent people were harassed to identify 4.84 times more "bad guys."  This is just plain bad management!  The pursuit of quantity over quality!

Graphed on the Right Hand Scale: Percents of Not Innocent Results by Year.
The purple line at the top of the chart shows the percent of Not Innocent results by year.  The high is in 2002 with 17.6% of stop & frisks resulting in a Not Innocent result.  That is about 1 in every 5.6 stop & frisks resulted in "success"!  The low percent is in 2006 where only 9.7% of stop & frisks resulted in "success."  That is 1 in every 10.3 stop & frisks results in "success."  The next two highest years are 2010 with 13.8% and 2007 with 13.0%.  The 2007 result is interesting since it follows the series low in 2006.  This implies that NYPD management was doing something to improve the quality along with increasing quantity that year.

The light green line depicts the change in Not Innocent percent.  The Greek letter delta (Δ) in "Δ Not Innocent %" is a math symbol meaning "change in."  The green line starts at zero percent, because the year 2002 is the beginning, unity year.  The percent shown for every other year is relative to 2002.  In all cases the percents for the other years are lower than 2002.  Notice that as the number of total stop & frisks increased in 2003, 2004, 2005 and 2006 the change in Not Innocent percent plummeted!  In 2006 there were 506,491 total stop & frisks, 5.2 time more stop & frisks tan in 2002, but they only got about 2.9 times more "bad guy"s. ( 49,328 for 2006 versus 17,129 for 2002.)  The results for 2006 were a 44.7% decrease in the percentage, from 2002 to 2006!  (17.6% to 9.7%.)  If the NYPD had gotten the same percentage "bad guys" in 2006 as in 2002, they would have gotten about 89,000 Not Innocent results instead of 49,000!  It is apparent that the NYPD noticed this disparity and made efforts to correct it in 2007.  In 2007 the NYPD decreased the number of stop & frisks to 472,096 and increased the numbers of Not Innocent results to  61,160.  This is the third highest Not Innocent percent in the series (13.0%) and implies that the NYPD made some efforts to improve quality of stop & frisks that in 2007.

.Notice that the green line drops slightly (indicating the NYPD had slacked off quality controls a bit) then jumps in 2010.  In each of the years 2008, 2009 and 2010 the total numbers of stop & frisks increases steadily from 472,096 in 2007 to 581,168 in 2010.  In 2010 the NYPD must have introduced some quality control efforts to increase the percentage of Not Innocent results to 13.8%, the second highest percentage rate in the series.

In 2011 the NYPD pursued quantity over quality and their "success" rates plunged again.  2011 is the 11 year peak in total stop & frisks, 685,724 but with a slight decrease in Not Innocent results from 82,963 to 80,396. Thus we see the purple line (percent of Not Innocent results) declines slightly and the green line (change in percent of Not Innocent results) plunges downward.  In fairness to the NYPD, the Occupy Wall Street protesters were active from mid-September until the end of the year.  The 2011 results may have been impacted by the protests.

In 2012, the last year in our series, the total number of stop & frisks decreased and the NYPD's "success rate" decreased too.  2012 has the lowest number of stop & frisks since 2008 ( 533,042) and a lower number of Not Innocent results than 2007 ( 59,742.)  This is the second lowest percentage of Not Innocent results (11.2%) in the 11 year series.  The green line again plunges downward. 

Conclusions:
There are underlying anomalies in the data, based on policy decision of the NYPD, who mostly pursued increased quantity of stop and frisks and only occasionally quality.  The year to year data by race is influenced by these underlying policy changes.  We must keep in mind when examining the data for each race that:
  • There was a steady increase in quantity from 2003 through 2006 with little regard to quality.
  • In 2007 quantity was decreased slightly and quality was increased considerably.
  • In 2008, 2009 & 2010 there was a steady increase in quantity and in 2010 a definite increase in quality too.
  • In 2011 there was a major increase of quantity with little regard to quality.
  • In 2012 there was a decrease in both quantity and quality.


1 Comment

Abandon All Hope Ye Who Enter Here!

9/20/2013

0 Comments

 
Federal Judge Shira Scheindlin has created an "Academic Advisory Council" made up of a dozen inexperienced, over educated nincompoops to assist her Facilitator in Chief to oversea the Mayor, Police Commissioner and NYPD's application of Stop & Frisk in New York City.

I thought we already had a committee of inept, nincompoops to do that?  They're called the City Council!

Why bother to elect a City Council when we now have an Imperial Judge nominating a committee of cronies to supersede them?

Hey, who needs democracy anyway!  Shira Scheindlin may as well appoint herself as Imperial Overseer of New York City.  We can do away with the Mayor too!  (The next one is likely to be Bill di Blasio, who is an inexperienced "Progressive" nincompoop who has his biracial son promise us "Change".  Not even "Hope and Change!"  "Abandon all Hope ye who enter here!")

0 Comments

Welcome to New York City the Apartheid Police State!

9/9/2013

1 Comment

 
The NYCLU published a summary of NYPD Stop & Frisk data, 2003 to 2012, at the following web page: http://www.nyclu.org/content/stop-and-frisk-data

I reviewed this data and compared it to US Census, State & County Quick Facts data for each county of New York City. I have determined that, under Mayor Bloomberg, New York City has become an apartheid police state. Between 2003 and 2012 the NYPD has done about 4.8 million stop & frisks on New York City's 8.3 million people, or the equivalent of 58% of the population! If 2013 is an average year for stop & frisks, the NYPD will have stopped and frisked the equivalent of about 60% of the population by the end of June! That is to say the NYPD has stopped & frisked the equivalent of about 6 in every 10 residents of New York City!

About 52% of all stop & frisks are done on Black New Yorkers, who are only 28% of the population. But only 10% are done on White New Yorkers, who are 54% of the population. For the ten year period, from 2003 to 2012, the NYPD has done stop & frisks on the equivalent of 105% of the Black population of New York City; but only on about 11% of the White population. On average, the NYPD does stop & frisks equaling 10.5% of Blacks every year. But they only do stop & frisks on about 1.1% of the Whites. Around 50% of all stop & frisks are done on people ages 14 to 24. About 88% of stop & frisks are done on people who are determined (by the NYPD) to be totally innocent.

Mayor Micheal Bloomberg has responded to this (on the John Gambling Show, WOR Radio, 710 AM) by saying:
“The test is, are you stopping a disproportionate percentage of people who fit the description that witnesses or victims have come up with of crimes that have been committed.”
and:
“The police have to be able to go out and stop, look for, those that fit the description of a witness or a victim of a crime.”
and:
“Most crimes in our city, serious crimes, are committed by male minorities 15 to 25."

Picture
Chart 1, “10 Year NYPD Stop & Frisk Data Compared to NYC Population by Race” Clearly shows the disparity by race. Note that there are more Stop and Frisks of Blacks than there are Black people in New York City! Mayor Bloomberg said, on WOR Radio, “It is society's job to make sure that no one group is disproportionally represented as potential perpetrators.” Mr. Bloomberg also said, "We disproportionately stop whites too much and minorities too little


Picture
Chart 2, “NYPD Stop & Frisk Data 10 Year Totals" Innocent and Not Innocent” clearly shows that 88% of people stopped & frisked are totally innocent. (In this, and the next, graph “Not Innocent” means the suspect was arrested, given a summons or both. It does NOT mean the suspect was found guilty of any crime.)


Picture
Chart 3, “NYPD Stop & Frisk data by Year: Innocent versus Not Innocent”  Mr. Bloomberg implies that when a crime has been committed the police look for a specific suspect. It's reported that crime has gone down in New York City, so why have stop & frisks been increasing?

Once again "Not Innocent" does NOT mean "Guilty." It means a suspect was given a summons, or arrested or both. In 2003 only 160,851 stop & frisks were done for the whole year! In 2011, 685,724 stop & frisks were done. This is 6.4 times more stop & frisks in 2011 as in 2003. It is also 8.2% of New York City's population of 8,336,697. Overall, the percent of Not Innocent results has remained rather constant at just under 12%.

Over the last 10 years the NYPD has done 4,792,673 stop & frisks, the equivalent of just under 58% of the population of New York City! Mayor Bloomberg insists that this excessive and obsessive number of stop & frisks is necessary to reduce crime in New York City. But most experts agree that crime decreased by about 1/3 in 1998 to 1999, and has decreased consistently every year since, regardless of the number of stop & frisks being done.


Picture
Chart 4: “NYPD Stop & Frisk Data: Over Focus on Blacks is Not Productive” The black line representing the change in percent of Blacks stopped & frisked every year increases from left to right, clearly showing the NYPD's increased focus on stopping & frisking Black citizens. The red line shows the change in percentage of "Not Innocent" results each year. Note that it does not track well with the change in percentage of Blacks stopped and frisked. In fact it has decreased while the focus on Blacks has increased.


Picture
Chart 5: "NYC Population by Race compared the NYPD Stop & Frisks by Race." The math for the Population by Race is off a bit because the US Census Quick Facts data double counts Hispanics as a group AND includes their data under each race group. However the size of the pie chart slices are sufficiently accurate for comparison.


Picture
Chart 6: NYC Population by race 2012 This is a mathematically correct pie chart of NYC's Population by Race as of 2012.

Note that the "Latino/Hispanic" category is not included. When people fill in census forms they identify themselves as being 100% White, 100% Black, 100% Asian, etc. or of Mixed Races. People who identify themselves as "Hispanic" also identify themselves as being 100% some other race (White, Black, Asian, etc. or Mixed.) Thus in the US census Data, "Hispanic" is more of a language and cultural affiliation, rather than a racial one.
The data here were developed from Census Quick Facts data by County, since I believe those to be more accurate than the Quick Facts data for New York City as a whole.


Picture
Table 1: NYPD Stop & Frisk Data by Race - 10 Year Totals (2003 to 2012)

(1) Latino row: In US Census data, the number of Hispanic people is double counted. On Census forms Hispanic people identify themselves as being 100% White, or 100% Black, or 100% Other and they also report themselves as Hispanic. Thus the 2.4 million “Latinos” in New York City are already included in the values for Black, White and Other. In the NYPD data (as interpreted by the NYCLU) the category for “Latino” is a separate value.

(2) TOTAL row: The correct population total for New York City, for 2012, is about 8,336,697 million. The sum of the numbers for Black + White + Other is about 0.1% less due to rounding errors. As mentioned above the “Latino” population is already included in the values for Blacks, Whites and Others. The values for Stop & Frisks are summed from the NYPD data (as interpreted by the NYCLU.)

(3) Stop & Frisks as a % of Population column: Yes, the number of stop & frisks done on Black New Yorkers is equivalent to almost 105% of the Black population of New York City. Meanwhile, slightly less than 11% of White New Yorkers have been subjected to stop & frisks. Are we to assume that 105% of our fellow Black New Yorkers are criminals? 105%!!!!

(4) Disparity: This is the measurement that a certain race is over represented or under represented in the Stop & Frisk data. If Blacks are about 28% of the population and if selecting for stop & frisks was random, we would expect that about 28% of stop & frisks would be of Black citizens. Instead we find that over 10 years almost 52% of stop & frisks are of Black citizens, thus Black citizens are about 82% over represented. On the other hand, Whites are about 82% under represented. It is obvious that the NYPD's selection of a citizen for a stop & frisk is far from random.

Picture
Table 2: "NYPD Stop & Frisk data 2011"   I have been reviewing the full Stop & Frisk data set for 2011. Note the NYPD data codes and descriptions, in order:
Code, Description
1, Black; 2,
Black Hispanic;
3, White Hispanic;
4, White;
5, Asian/Pacific Islander;
6, American Indian/Native Alaskan.

I added the -999 code for records with blank data. The other codes and descriptions are those used by the NYPD.
Mayor Mike Bloomberg said, on WOR Radio, “A cop must have explicit instructions.”

If I were a NYPD police officer, would I be wrong in thinking that the number one preferred choice for a stop & frisk, is coded number “1”? Are you surprised that the number one choice, coded number “1,” also accounts for the highest number of stop & frisks? (What a coincidence!)

If these codes are in alphabetical order, why is "Asian" number 5?


1 Comment

My Positions on NYPD Stop & Frisk Program

9/6/2013

2 Comments

 
I began reviewing the NYPD Stop & Frisk Data published by the NYCLU at their web site:
http://www.nyclu.org/content/stop-and-frisk-data

I was curious to see if there were any racial bias and to what degree.  I discovered that there is horrendous racial bias in the selection of people to be stopped & frisked.  In the last ten years (2003 to 2012) the NYPD has done stop & frisks on the equivalent of 105% of the black population of New York City.  During the same time they have done stop & frisks on the equivalent of only 11% of the white population.  If 2013 is an average year, the NYPD will have done stop & frisks on the equivalent of 60% of the total population of new York City by the end of June, 2013.  That is to say, on the equivalent of 6 in every 10 of all New Yorkers!  I find this to be horrendous!  Under Mayor Bloomberg and Police Commissioner Kelly New York City has become a police state, particularly if you are black.

I wrote letters to the NYCLU & my local politicians and included a copy of my study.  This was during the trial on stop & frisk earlier this year.  The politicians have taken action, and passed new laws, in part because of the court trial, in part because of the NYCLU and perhaps in part because of my study.  I provided a copy of my study to Glenn Beck & his BlazeTV team, and the NYPD Stop & Frisk Program was discussed on Real News on The Blaze.

There's been a lot of talk, controversy and developments on this subject:
  • Bloomberg & Kelly have defended the Stop & Frisk Program.
  • In some cases it is now being called the "Stop, Question & Frisk" program.
  • Bloomberg claims the program focuses on young blacks because they commit 95% of the crimes.
  • The court trial ended.  Judge Shira Scheindlin declared that the program violates civil rights and appointed Nicholas Turner, president of the VERA Institute of Justice, as the facilitator for reforms of the NYPD's stop-and-frisk practices.
  • The New York City Council has passed new laws over Mayor Bloomberg's veto. These include:
  • created a new position of Inspector General for the NYPD, and;
  • provisions that make it easier for a citizen to sue the police officer & NYPD if they feel they suffered racial bias.
  • During the current Mayor campaign liberal candidates are mostly in line to end stop & frisks completely, while conservative candidates want to keep stop & frisk as is.
My own positions on this are:
  • The NYPD does need to do some stop & frisks to control crime in New York City.  However, I think Bloomberg & Kelly are doing it to a degree that is excessive and obsessive and racist.  (There is simply no doubt of that!) 
  • The Judge appointed a federal reviewer because Bloomberg & Kelly are unwilling to reign in their excesses.  And the City Council seems hapless to control the Mayor & Police Commissioner.
  • I would have preferred that the City Council merge the "Inspector General" position into the already existing "Public Advocate" position, rather than make a new bureaucrat and bureaucracy.
  • I think making it easier to sue the individual police officer and the NYPD is misguided.  First, suing somebody is after the fact.  I would rather we use reasonable control & management first  Second, there is evidence that the racial bias is not because of the individual police officer, but because of the whole chain of command, starting with the Mayor & Police Commissioner.  It is unfair to make the police officer responsible for management policies.  Third, this will mostly make lawyers rich at the public expense.

I have my own business as a dog walker & pet sitter on Staten Island.  Summer is my busy season and I have not had time devote to this project. Originally, I put a full copyright on my documents.  A friend suggested I use a Creative Commons license that would allow others to work on this project without fear of infringing my copyright.  I have selected this license:

Attribution-NonCommercial-ShareAlike
CC BY-NC-SA


"This license lets others remix, tweak, and build upon your work non-commercially, as long as they credit you and license their new creations under the identical terms."

You can read more about Creative Commonsd licenses at:
http://creativecommons.org/licenses/

I posted a copy of my study online for you to review.  The study is a collection of PDF files in a ZIP file located here:
(This doesn't work quite as planned.  Copy & past to a URL searcher spot on your browser.)
http://www.filedropper.com/nypdstopandfiskstudy2003to2012asof2013-09-06

Or maybe this will work better:
<a href=http://www.filedropper.com/nypdstopandfiskstudy2003to2012asof2013-09-06><img src=http://www.filedropper.com/download_button.png width=127 height=145 border=0/></a><br /><div -size:9px;font-family:Arial, Helvetica, sans-serif;width:127px;font-color:#44a854;> <a href=http://www.filedropper.com >upload files online</a></div>

Bill Keck
Staten Island, NY


2 Comments

    Bill Keck

    I am a resident of Staten Island and and began reviewing NYPD Stop & Frisk data published on NYCLU page.

    Archives

    July 2014
    December 2013
    November 2013
    October 2013
    September 2013

    Categories

    All

    RSS Feed

Powered by Create your own unique website with customizable templates.