The NYCLU published a summary of NYPD Stop & Frisk data, 2003 to 2012, at the following web page: http://www.nyclu.org/content/stop-and-frisk-data
I reviewed this data and compared it to US Census, State & County Quick Facts data for each county of New York City. I have determined that, under Mayor Bloomberg, New York City has become an apartheid police state. Between 2003 and 2012 the NYPD has done about 4.8 million stop & frisks on New York City's 8.3 million people, or the equivalent of 58% of the population! If 2013 is an average year for stop & frisks, the NYPD will have stopped and frisked the equivalent of about 60% of the population by the end of June! That is to say the NYPD has stopped & frisked the equivalent of about 6 in every 10 residents of New York City!
About 52% of all stop & frisks are done on Black New Yorkers, who are only 28% of the population. But only 10% are done on White New Yorkers, who are 54% of the population. For the ten year period, from 2003 to 2012, the NYPD has done stop & frisks on the equivalent of 105% of the Black population of New York City; but only on about 11% of the White population. On average, the NYPD does stop & frisks equaling 10.5% of Blacks every year. But they only do stop & frisks on about 1.1% of the Whites. Around 50% of all stop & frisks are done on people ages 14 to 24. About 88% of stop & frisks are done on people who are determined (by the NYPD) to be totally innocent.
Mayor Micheal Bloomberg has responded to this (on the John Gambling Show, WOR Radio, 710 AM) by saying:
“The test is, are you stopping a disproportionate percentage of people who fit the description that witnesses or victims have come up with of crimes that have been committed.”
and:
“The police have to be able to go out and stop, look for, those that fit the description of a witness or a victim of a crime.”
and:
“Most crimes in our city, serious crimes, are committed by male minorities 15 to 25."
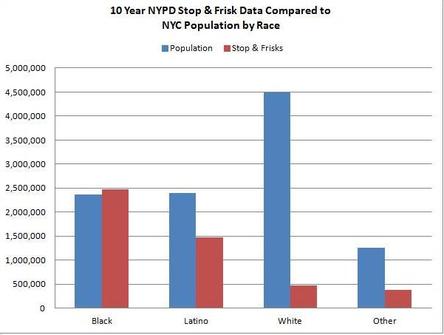
Chart 1, “10 Year NYPD Stop & Frisk Data Compared to NYC Population by Race” Clearly shows the disparity by race. Note that there are more Stop and Frisks of Blacks than there are Black people in New York City! Mayor Bloomberg said, on WOR Radio, “It is society's job to make sure that no one group is disproportionally represented as potential perpetrators.” Mr. Bloomberg also said, "We disproportionately stop whites too much and minorities too little
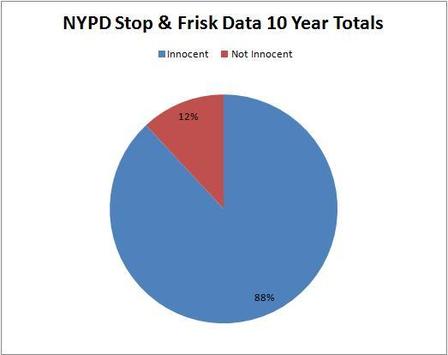
Chart 2, “NYPD Stop & Frisk Data 10 Year Totals" Innocent and Not Innocent” clearly shows that 88% of people stopped & frisked are totally innocent. (In this, and the next, graph “Not Innocent” means the suspect was arrested, given a summons or both. It does NOT mean the suspect was found guilty of any crime.)
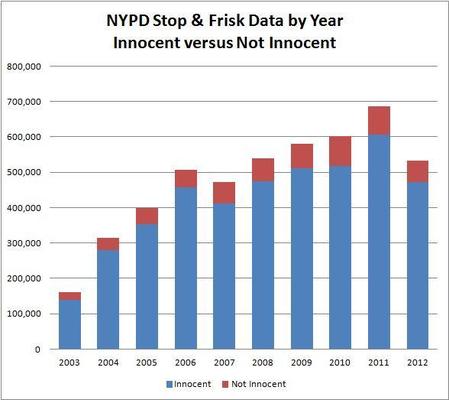
Chart 3, “NYPD Stop & Frisk data by Year: Innocent versus Not Innocent” Mr. Bloomberg implies that when a crime has been committed the police look for a specific suspect. It's reported that crime has gone down in New York City, so why have stop & frisks been increasing?
Once again "Not Innocent" does NOT mean "Guilty." It means a suspect was given a summons, or arrested or both. In 2003 only 160,851 stop & frisks were done for the whole year! In 2011, 685,724 stop & frisks were done. This is 6.4 times more stop & frisks in 2011 as in 2003. It is also 8.2% of New York City's population of 8,336,697. Overall, the percent of Not Innocent results has remained rather constant at just under 12%.
Over the last 10 years the NYPD has done 4,792,673 stop & frisks, the equivalent of just under 58% of the population of New York City! Mayor Bloomberg insists that this excessive and obsessive number of stop & frisks is necessary to reduce crime in New York City. But most experts agree that crime decreased by about 1/3 in 1998 to 1999, and has decreased consistently every year since, regardless of the number of stop & frisks being done.
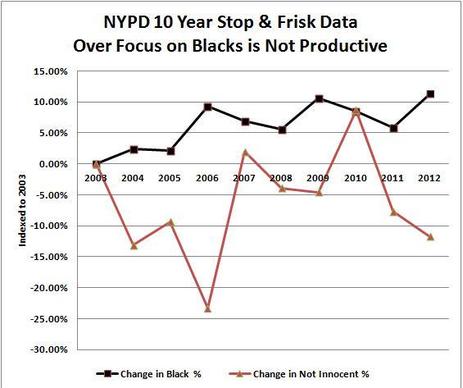
Chart 4: “NYPD Stop & Frisk Data: Over Focus on Blacks is Not Productive” The black line representing the change in percent of Blacks stopped & frisked every year increases from left to right, clearly showing the NYPD's increased focus on stopping & frisking Black citizens. The red line shows the change in percentage of "Not Innocent" results each year. Note that it does not track well with the change in percentage of Blacks stopped and frisked. In fact it has decreased while the focus on Blacks has increased.
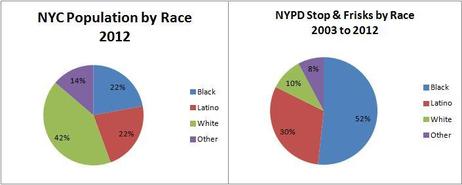
Chart 5: "NYC Population by Race compared the NYPD Stop & Frisks by Race." The math for the Population by Race is off a bit because the US Census Quick Facts data double counts Hispanics as a group AND includes their data under each race group. However the size of the pie chart slices are sufficiently accurate for comparison.
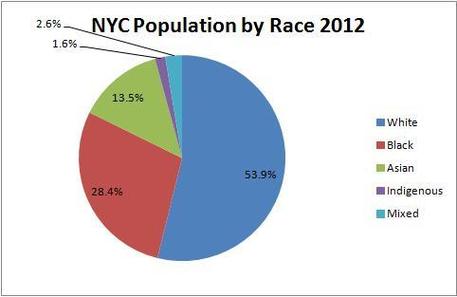
Chart 6: NYC Population by race 2012 This is a mathematically correct pie chart of NYC's Population by Race as of 2012.
Note that the "Latino/Hispanic" category is not included. When people fill in census forms they identify themselves as being 100% White, 100% Black, 100% Asian, etc. or of Mixed Races. People who identify themselves as "Hispanic" also identify themselves as being 100% some other race (White, Black, Asian, etc. or Mixed.) Thus in the US census Data, "Hispanic" is more of a language and cultural affiliation, rather than a racial one.
The data here were developed from Census Quick Facts data by County, since I believe those to be more accurate than the Quick Facts data for New York City as a whole.

Table 1: NYPD Stop & Frisk Data by Race - 10 Year Totals (2003 to 2012)
(1) Latino row: In US Census data, the number of Hispanic people is double counted. On Census forms Hispanic people identify themselves as being 100% White, or 100% Black, or 100% Other and they also report themselves as Hispanic. Thus the 2.4 million “Latinos” in New York City are already included in the values for Black, White and Other. In the NYPD data (as interpreted by the NYCLU) the category for “Latino” is a separate value.
(2) TOTAL row: The correct population total for New York City, for 2012, is about 8,336,697 million. The sum of the numbers for Black + White + Other is about 0.1% less due to rounding errors. As mentioned above the “Latino” population is already included in the values for Blacks, Whites and Others. The values for Stop & Frisks are summed from the NYPD data (as interpreted by the NYCLU.)
(3) Stop & Frisks as a % of Population column: Yes, the number of stop & frisks done on Black New Yorkers is equivalent to almost 105% of the Black population of New York City. Meanwhile, slightly less than 11% of White New Yorkers have been subjected to stop & frisks. Are we to assume that 105% of our fellow Black New Yorkers are criminals? 105%!!!!
(4) Disparity: This is the measurement that a certain race is over represented or under represented in the Stop & Frisk data. If Blacks are about 28% of the population and if selecting for stop & frisks was random, we would expect that about 28% of stop & frisks would be of Black citizens. Instead we find that over 10 years almost 52% of stop & frisks are of Black citizens, thus Black citizens are about 82% over represented. On the other hand, Whites are about 82% under represented. It is obvious that the NYPD's selection of a citizen for a stop & frisk is far from random.
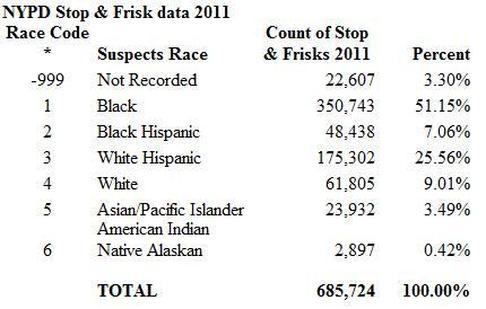
Table 2: "NYPD Stop & Frisk data 2011" I have been reviewing the full Stop & Frisk data set for 2011. Note the NYPD data codes and descriptions, in order:
Code, Description
1, Black; 2,
Black Hispanic;
3, White Hispanic;
4, White;
5, Asian/Pacific Islander;
6, American Indian/Native Alaskan.
I added the -999 code for records with blank data. The other codes and descriptions are those used by the NYPD.
Mayor Mike Bloomberg said, on WOR Radio, “A cop must have explicit instructions.”
If I were a NYPD police officer, would I be wrong in thinking that the number one preferred choice for a stop & frisk, is coded number “1”? Are you surprised that the number one choice, coded number “1,” also accounts for the highest number of stop & frisks? (What a coincidence!)
If these codes are in alphabetical order, why is "Asian" number 5?
 RSS Feed
